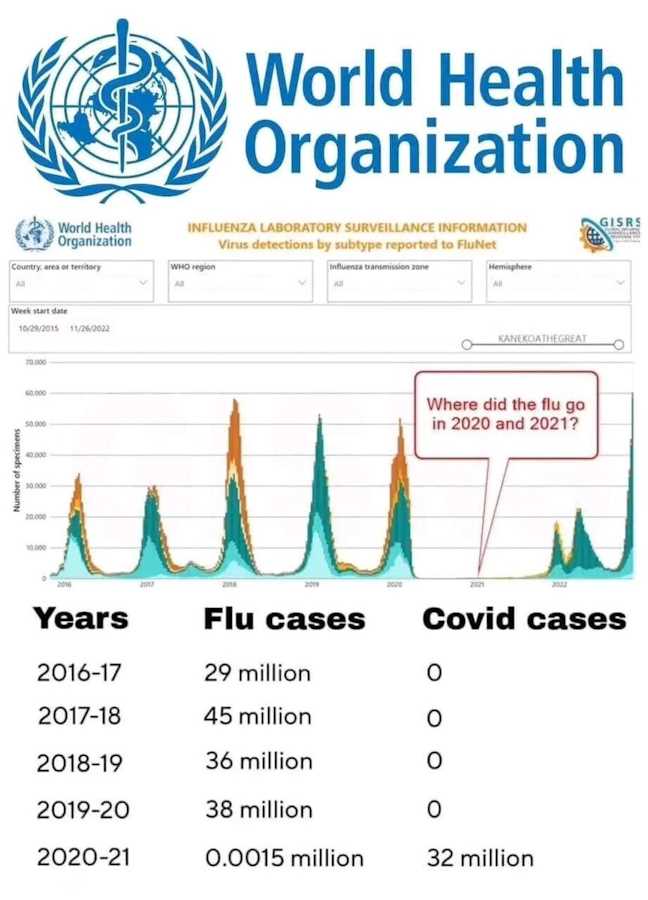
Across many parts of the world “the flu” disappeared in 2020, not to return until late 2021, the question is why?
“The flu” includes all respiratory viruses that cause flu-like symptoms, not just influenza, yet influenza has been the target virus, said to be “associated” with the burden of deaths. Not just influenza, but all influenza-like illness (ILI) disappeared shortly after the pandemic was declared March 11, 2020. What caused the dramatic exit? Was there in fact no incidence of ILI or were and flu-like cases redirected to COVID-19? Was it the “power of the pen” coupled with a not-fit-for-purpose “diagnostic” test that make everyone statistically ill with COVID-19? And what would be the purpose of that!!!?
Did PCR testing “diagnose” COVID-19 in place of other flu’s?
A Recap:
On January 13, 2020 the World Health Organisation (WHO) publishes the protocol for RT-PCR assay designed by a WHO partner laboratory to diagnose infection of the novel coronavirus. Then on January 30, 2020 they declare a Public Health Emergency of International Concern (PHEIC), which sets in motion the production of PCR test kits for the “novel coronavirus” under emergency use legislation. By the next week the “super spreader” narrative was born, a phenomenon where healthy people, showing no symptoms (asymptomatic), were allegedly spreading the virus.
COVID-19 was declared by the WHO as a “pandemic” on March 11, 2020 after which PCR testing for “COVID-19” was ramping up all over the world (note they never called it SARS-CoV-2 testing!). As an example, on that very same day in my state of South Australia, the first drive-through testing clinic opened south of Adelaide, of which anyone could get PCR tested for “COVID-19”, no matter if they had flu symptoms or not.
Public Health and the media had promoted the super-spreader narrative hard, images of people dying were constantly reported and the people had become super fearful of catching the “deadly” virus, especially from their healthy neighbour! On March 16, 2020 the WHO Director-General declared all countries mush “test, test, test” on the premise that in doing so is “the only way to really understand how much the coronavirus is spreading” – because too many DIDN’T become seriously ill!
Greater than 33 cycles not viable virus
On March 31, 2020 French doctor and researcher Dr Didier Raoult and colleagues, published a paper on a pre-print server where their data showed that any “positive” RT-PCR test cycled greater than 33-34 cycles does not have viable virus, meaning the person is not contagious. Tests cycled greater than 33 would return a false positive 80% of the time, meaning any genetic material detected was NOT viable virus, meaning the virus can not replicate, for all intents it is “dead”. Infecting another person was not probable.
PCR testing labs use 40-45 cycles
By mid-March 2020 everything was in place for escalating the COVID-19 “case” statistics. A case being anyone with a positive (or false positive) PCR result – with or without symptoms of illness. The PCR test kit production was in full swing, public health and the media had instilled the fear, the countries had established their drive-through testing sites and the testing labs were instructed to cranked up the PCR cycles to an unprecedented threshold of 40-45 cycles – a sure way to return a “positive” result.
To understand this, the labs doing the PCR testing could keep churning the machines over and over and over right up to a set cut-off point, in the case of COVID-19 tests this was set high, at 40 or 45 cycles, depending on the country – instead of stopping at 33 cycles. The machine would stop when a fluorescence was indicated. If the machine was set to keep going through 40 cycles a fluorescence was likely to occur, and as such a “positive” result was likely. A meaningless result clinically, but great for the “COVID-19 case” toll.
But add to this, the testing labs did not report the cycle threshold (Ct) for ANY test. Reporting the Ct value for any PCR test, under normal circumstances is necessary for a doctor to confirm a diagnosis, if the Ct was really high then the diagnosis may be incorrect. PCR tests have a history of causing fake or “pseudo-epidemics“.
If someone had flu-like symptoms from mid-2020 and a COVID-19 PCR test was undertaken, there was a strong chance of a positive result and so their ILI would be diagnosed as COVID-19 where true or not. That person could have had any number of the respiratory illnesses, but because the PCR tests were dialled up so high, they became a COVID-19 case.
Dr Tyson state [@47min] back in August 2021, that on death certificates of those who died of/with COVID-19 around early March/April 2020, many also had Influenza A or B listed too, meaning they had multiple infections. Once the influenza tests kits ran out, I guess they could no longer determine the existence of other pathogens.
What could explain where the flu went?
So where exactly did flu go in 2020? Was it PCR testing, the excellent selective filtering of cloth masks (SARS-CoV-2 still got through!), or was it because of lockdowns!? Was it the mass flu-vaccine campaign in early 2020 that worked on all viruses? Did COVID-19 out-compete ALL other respiratory viruses? Was it all of the above, more, or was it simply just re-categorised and never disappeared?
This page will capture information pertaining to respiratory viruses categorised as flu, influenza and influenza-like illness in relation to helping discover what happened to “the flu” in 2020-21, and why it returned in late 2021. I will include some historical data for more context.
Any non-influenza flu disappeared in the 1918 pandemic too!
Did you know that during the 1918 pandemic, as reported in US vital statistics, all respiratory viruses besides influenza, disappeared! Death certificates were influenza or pneumonia. [see 1918 below]
Two popular competing explanations for why ‘flu’ vanished from the globe in 2020/21 only to return 2021/22 and in some counties not until 2022/23 – according to PANDA:
- The first is that viral interference between SARS-CoV-2 and flu, where flu was outcompeted by SARS-CoV-2, lead to a collapse in flu rates. i.e. competition
- The second is that human interference caused reported flu rates to drop. Changes in flu testing, testing protocols and sequencing, and the partial demolition of national flu surveillance systems, may each have contributed to a reduction in reported flu rates, meaning that a form of observation bias may have hidden flu.” i.e. power of the pen and accessibility to testing
Lack of “flu” broke CDC’s computer model!
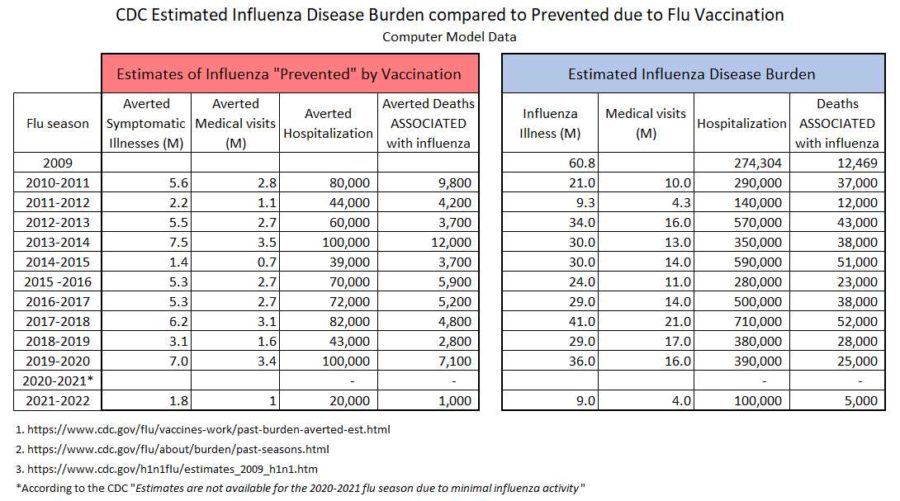
The 2020-2021 computer model estimates for Influenza Burden and how much Influenza was “prevented” by vaccination are not available “due to minimal influenza activity” according to the CDC. I wonder how much respiratory virus testing was actually done over the entire period? I can’t find that data.
But the fact that they have to detect influenza in order to determine if the vaccine works is strange. This means someone has to have positive test for influenza when the are vaccinated, to determine the vaccine is “preventative” for symptomatic illness and averting medical visits. That doesn’t make sense to me.
CDC estimated influenza-associated disease burden
compared to
CDC estimated flu-vaccine protected data
Some helpful data sources:
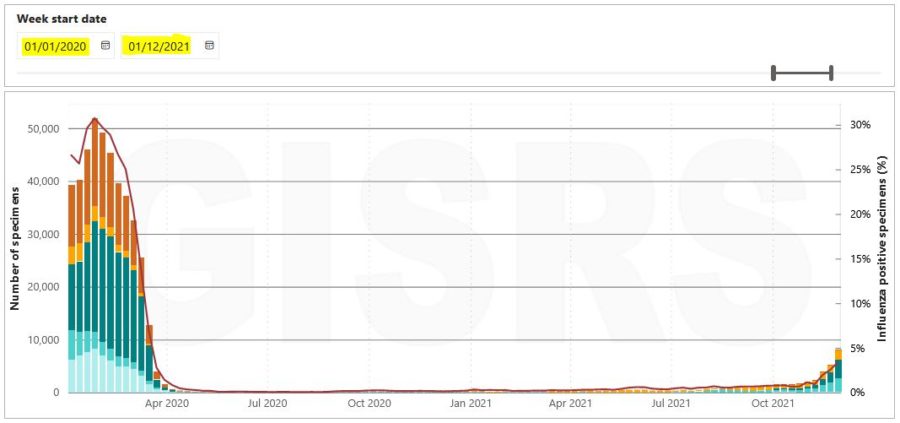
- World Health Organisation (WHO) FluNet surveillance – HERE, View FluNet Charts (click big button) – HERE
- U.S. Influenza Surveillance System – CDC FluView – US weekly influenza surveillance – HERE, weekly overview – HERE, ARCHIVES, Past Weekly Surveillance Reports – HERE

- CDC Influenza Hospitalization Surveillance Network (FluSurv-NET) – HERE
- CDC National Center for Immunization and Respiratory Diseases (NCIRD) “flu” division – HERE
- Influenza testing methods – HERE
- Where are the numbers? Substack | by two academic professors – Norman Fenton and Martin Neil – Vanishing Flu stacks – HERE
Research links in reverse chronological order
2023
December 11, 2023 – Bill rice Jr Substack: Flu Season of 2019-2020 was one of worst in decades – READ
- “…far more people than normal experienced ILI/Covid symptoms in the weeks and months before Covid was supposed to exist in America”
- “The number of flu tests administered in 2019-2020 was massively higher than in previous flu seasons, including the severe flu season of 2017-2018.” Because people were sick enough to go to their doctor.
September 18, 2023 – Rounding the Earth Substack by Mathew Crawford: How Flu Vaccines Accidentally Reveal the Efficacy Illusion – READ
- “It turns out that along with RSV and parainfluenza, metapneumovirus exploded in prevalence during the COVID-era, just after the rollout of the COVID-19 vaccines”
July 17, 2023 – PANDA: Where did the flu go? | Prof Martin Neil – WATCH, Vanishing flu – SUBSTACK
- By drawing on publicly available data, this talk presents evidence on these sources of observation bias and claim that there appears to have been a concerted effort in the UK and USA to ‘hide’ the flu from public attention for the early period of the Covid ‘pandemic’.
- Martin Neil is Full Professor of Statistics and Computer Science at Queen Mary University of London. He has published on Covid prevalence and fatality rate estimation, estimation of asymptomatic transmission, meta-analysis of ivermectin treatment studies, and assessing vaccine effectiveness and safety using mortality statistics.”
July 13, 2023 – Doc Malik: Where Did The “Missing Flu” Go? Prof Martin Neil Discusses “The Flu” And More – WATCH
July 4, 2023 – The Aussie Wire: The Great Vanishing Act; COVID-19 vs. Flu – Jordan Schachtel shares the data that begs the question: Where did the flu go? – WATCH, READ
June 24, 2023 – The Dossier Substack by Jordan Schachtel: How the Flu “disappeared” during the Covid era – The Flu did not disappear, it was simply rebranded as Covid. With further commentary from the long time lead scientist of the CDC’s molecular diagnostic laboratory – READ
- The flu tests were not physically available in US healthcare systems 2020-21 – only COVID-19 tests
- The flu is not understood in its proper context – Flu has almost always been diagnosed by symptoms, not by a swab test (subjective) and COVID-19 symptoms are virtually identical to flu symptoms – cased by any of the respiratory viruses.
- Traditionally very few doctor-diagnosed “flu” cases actually come from an influenza virus strain
May 26, 2023 – Where are the numbers? | Prof Martin Neil: Finding the Flu is easy, just Google it! – The flu supposedly vanished during the SARS-Cov-2 pandemic, but internet searches for ‘flu’ continued as normal. – SCREENSHOTS – READ
- “It is therefore well established that an increase in internet searches for keywords is a reliable indicator of some spreading disease or pathogen is affecting the general public.”
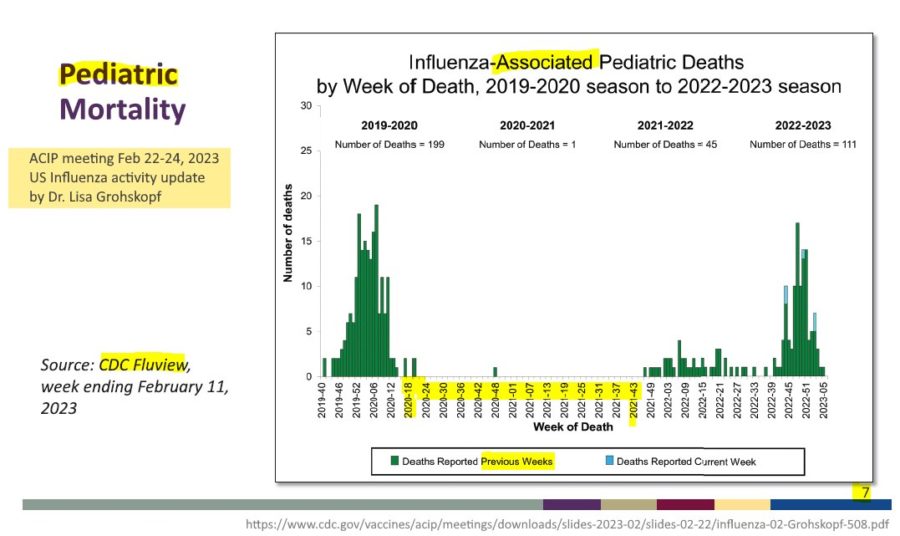
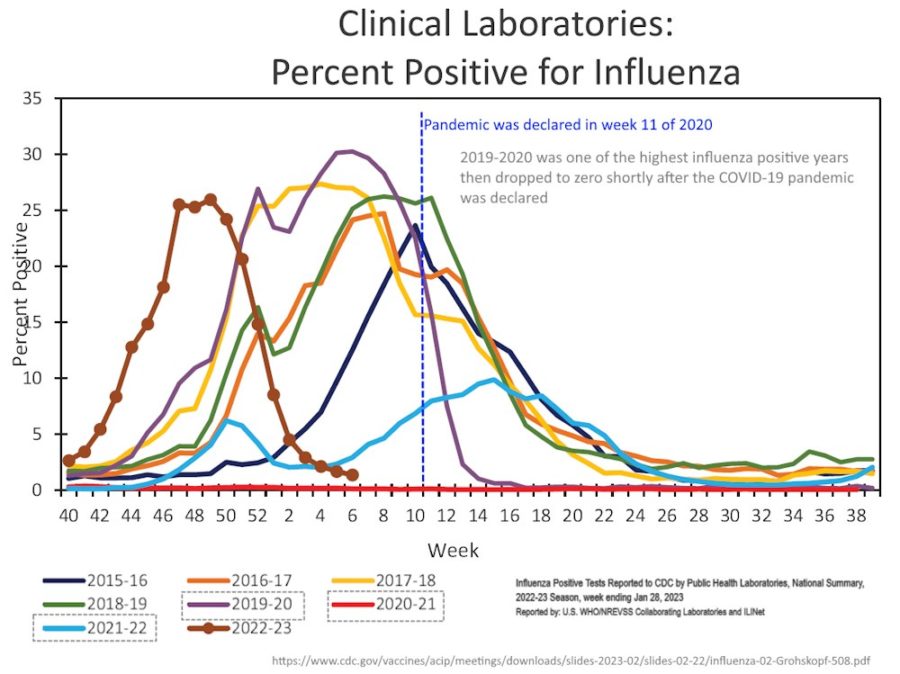
February 22, 2023 – CDC ACIP meeting: National Center for Immunization and Respiratory Diseases (NCIRD) – US Influenza Activity update by Dr. Lisa Grohskopf – SLIDES, all sessions – SOURCE, ARCHIVE,
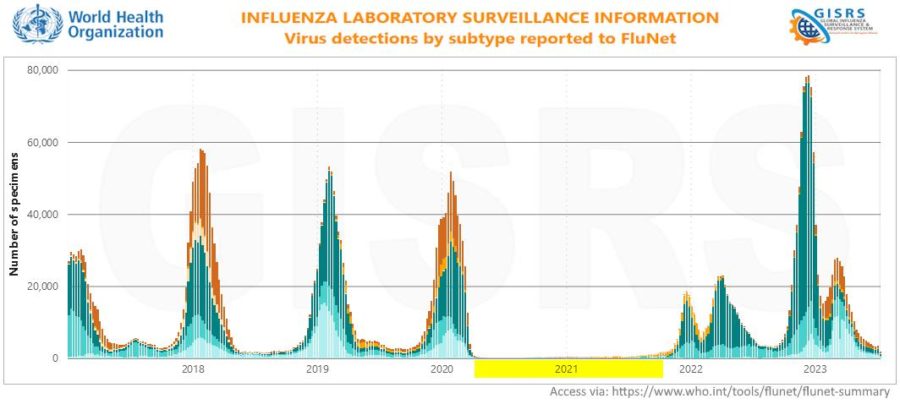
- From the graphs presented at ACIP meeting, influenza was not detected by labs from week 17 2020 and returned week 45 of 2021 – 80 weeks in total. What information would be handy is the number of specimens tested.
- Graph of all respiratory illness 2017-2023 from CDC – HERE
2022
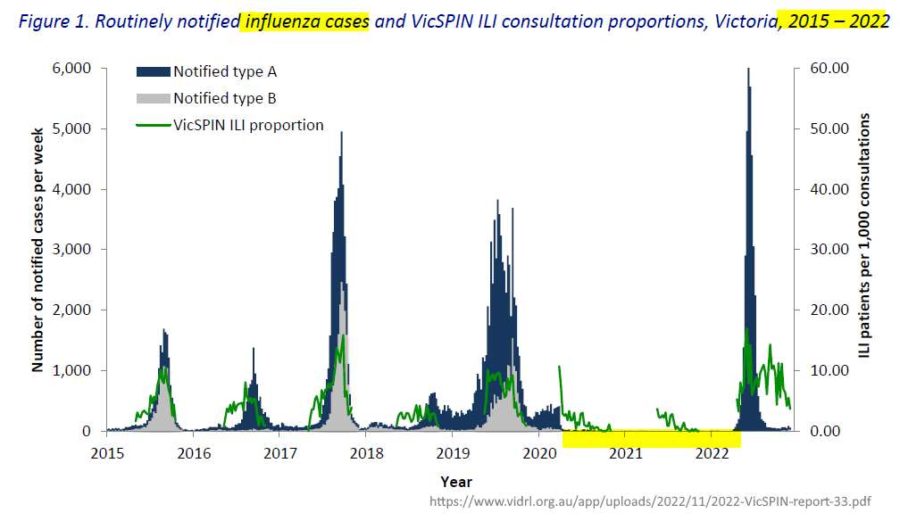
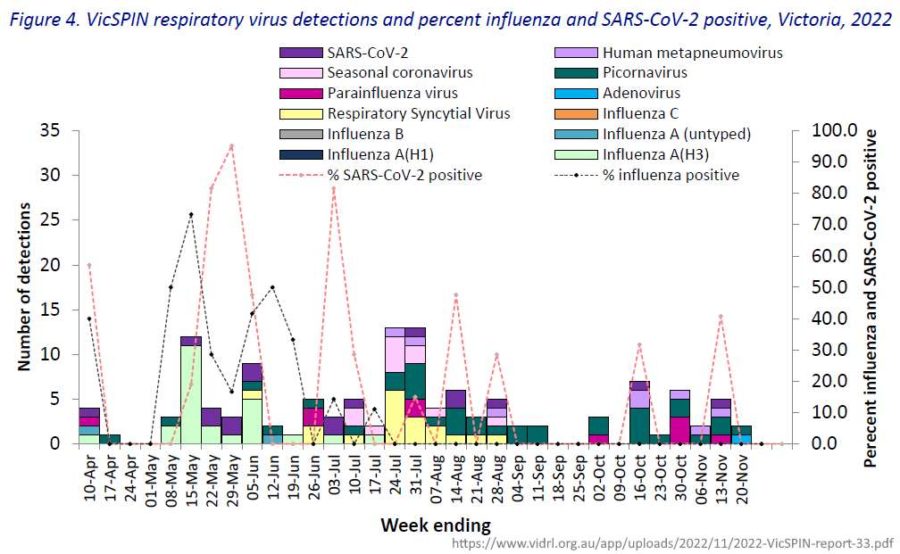
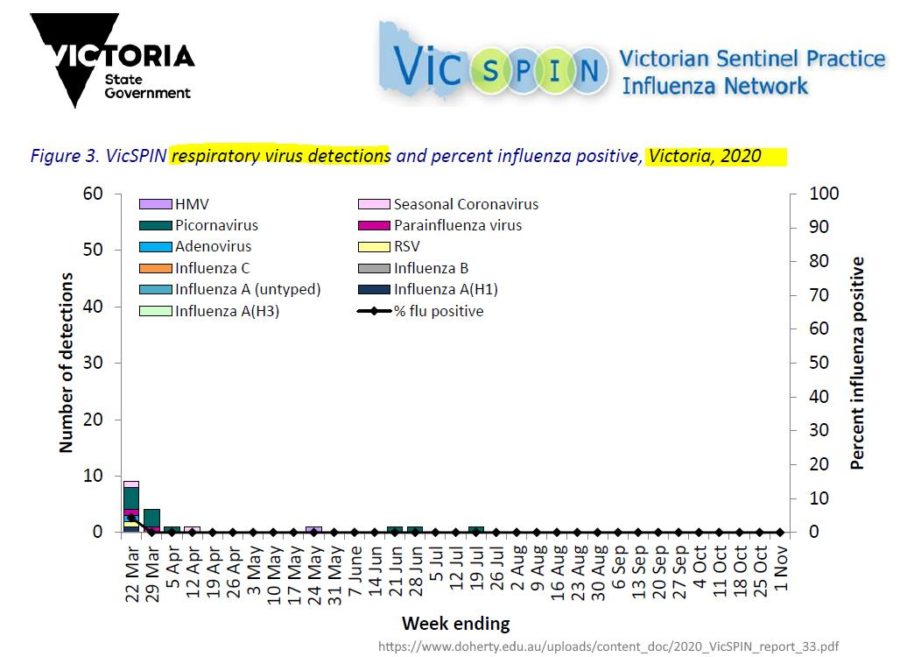
November 20, 2022 – Victorian Sentinel Practice Influenza Network (VicSPIN) Report No. 33 – PDF, ARCHIVE – Where did the flu go?! -All reports – HERE, ARCHIVE – [Curiously July 2023 at the time of writing, middle of winter and there are no 2023 surveillance reports listed a Victoria Infectious Diseases Reference Laboratory (VIDRL)]
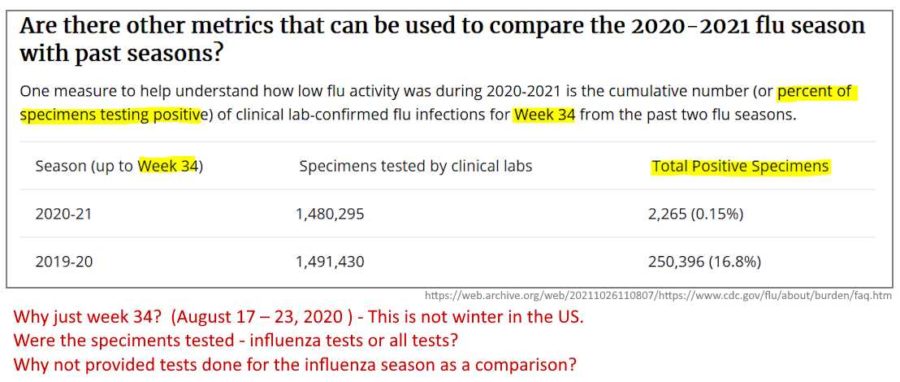
October 21, 2021 – CDC: Frequently Asked Questions about Estimated Flu Burden – Q: Why aren’t there flu burden estimates for the 2020-21 flu season? – READ, ARCHIVE
- To produce Influenza estimates, the “CDC uses a mathematical model that is based in part on the number of people that are hospitalized with flu in our hospitalization surveillance network, FluSurv-NET. During the 2020-2021 season, however; the number of people hospitalized with flu was too low to generate stable burden estimates as is done for a typical flu season.”
- Flu activity 2020-2021 was “the lowest it has been since current reporting began in 1997” – REF
February 28, 2022 – JAMA: Mortality Associated With Influenza and Respiratory Syncytial Virus [RSV] in the US, 1999-2018 – Hansen et al – PDF
- “no study has assessed changes in influenza mortality after the 2009 pandemic. Updated burden estimates are needed to characterize long-term changes in the epidemiology of these viruses”
- [just in time as RSV is on the rise!, also see 2003 study below by Thompson et al]
2021
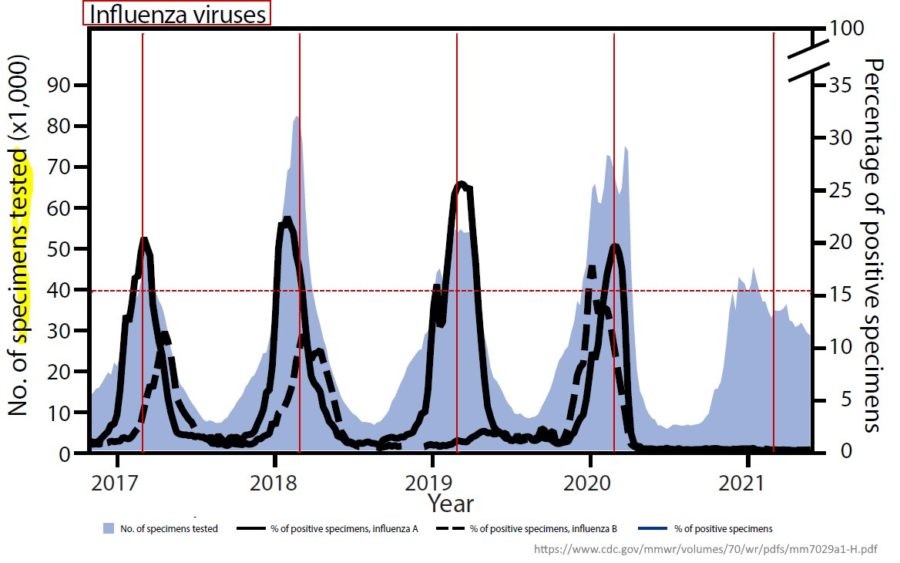
July 23, 2021 CDC MMWR Vol 70, No. 29: Changes in Influenza and Other Respiratory Virus Activity During the COVID-19 Pandemic — United States, 2020–2021 – READ, ARCHIVE, PDF
- <0.4% of respiratory specimens with positive test results for each week of the season was detected during this nil activity time – View graphs of all respiratory viruses – IMAGE
- Includes reference to 2020-2021 “being lowest flu season since 1997 when records began”
CDC MMWR – source
2020
December 15, 2020 – The Dossier: Welcome to the COVID Testing Industrial Complex, which is fast becoming a $100 billion a year industry – READ [why do you think flu tests were pushed aside?]
November 1, 2020 – VicSPIN Report 33: Flu season in Australia, ALL RESPIRATORY viruses disappeared, not just influenza – PDF, ARCHIVE, Compared to surveillance in 2019.
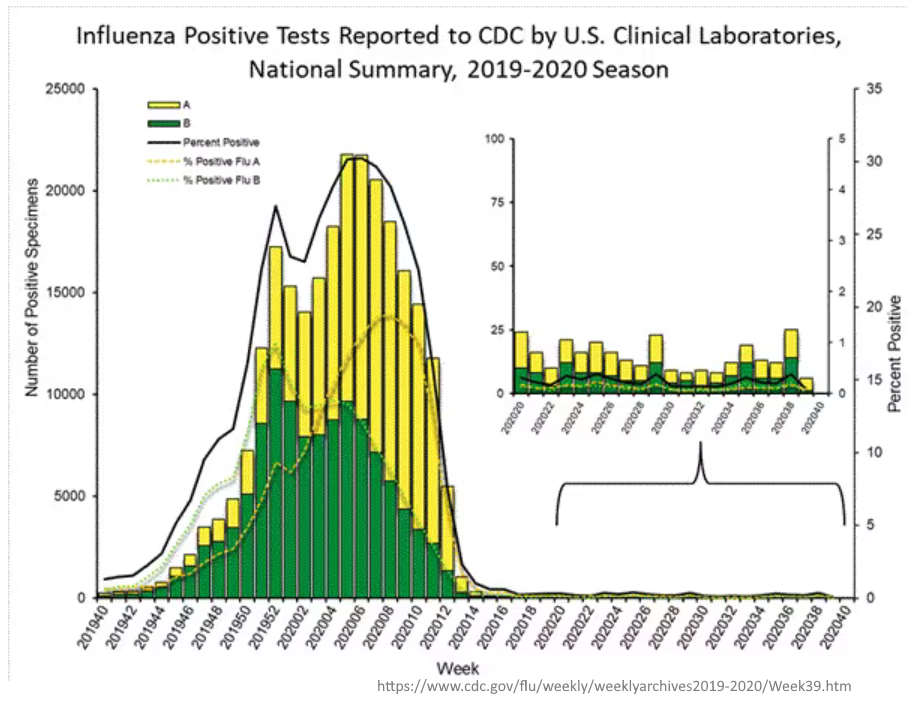
September 26, 2020 – FluView Summary ending on September 26, 2020 Week 39 (official end date of 2019-2020 flu season in the US) – READ, SOURCE
July 24, 2020 – Harvard University: How COVID-19 Causes Loss of Smell– Olfactory support cells, not neurons, are vulnerable to novel coronavirus infection – READ
- “Temporary loss of smell, or anosmia, is the main neurological symptom and one of the earliest and most commonly reported indicators of COVID-19″
- But loss of smell is not unique or novel , there are many factors that cause it – READ
June 6, 2020 – Michigan Flu Focus: Weekly Influenza Surveillance Report (See graphs) – PDF

April 25, 2020 – Bloomberg: The Coronavirus Isn’t Just the Flu, Bro – Results from recent blood tests show how widely the disease has spread, and they indicate that Covid-19 is many times deadlier than seasonal influenza – READ [Countering Professor Ioannedis etc. studies on infection fatality rate]
March 11, 2020 – The WHO declared a pandemic. Shortly after this, Influenza rapidly declined and disappeared.
2019
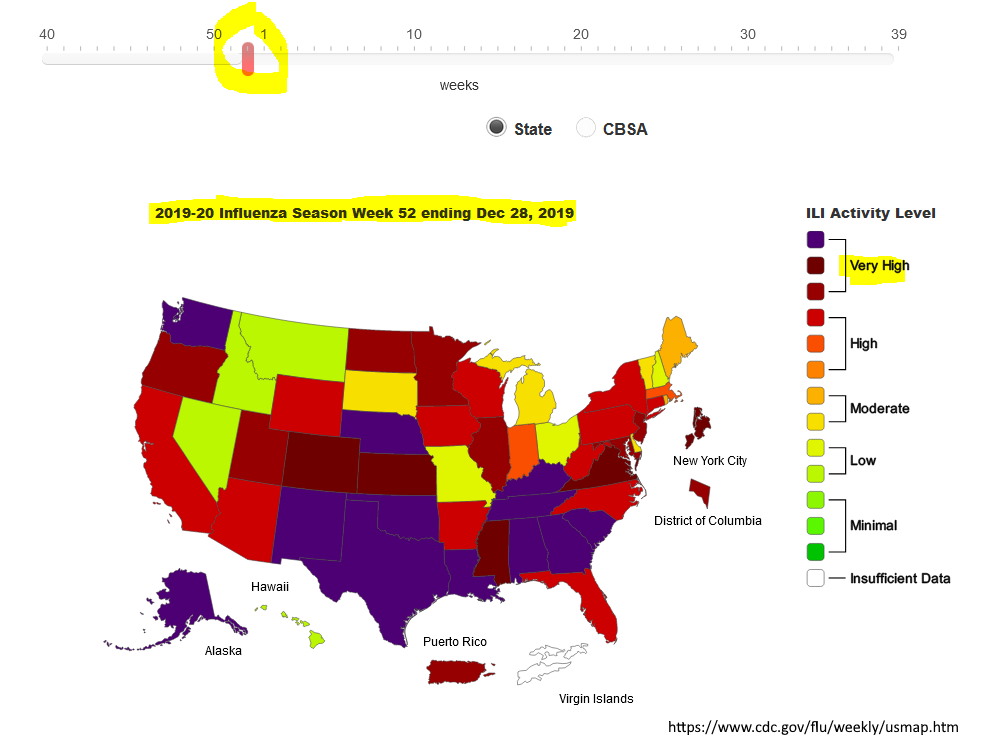
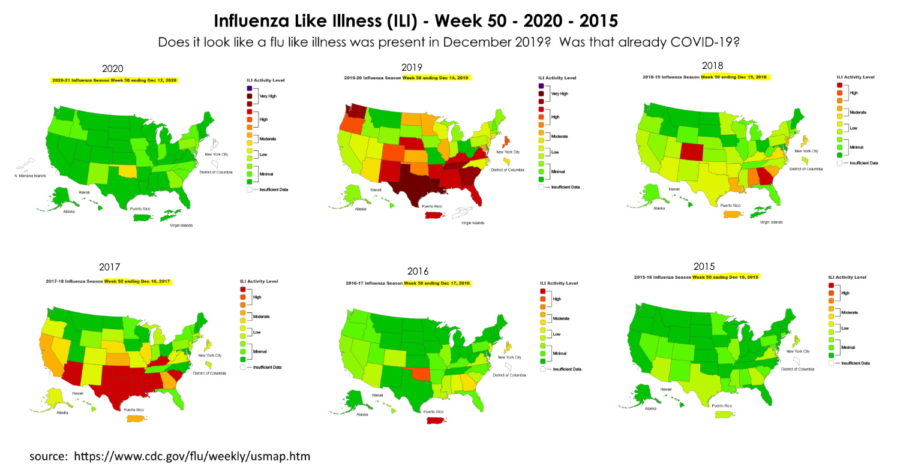
December 28, 2019 – CDC flu tracking in USA – Week 50-52 in the United States showed wide-spread and high Influenza-Like Illness (ILI) – was this SARS-CoV-2 spreading aleady?
December 18, 2019 – Estimated Influenza Illnesses, Medical Visits, Hospitalizations, and Deaths Averted by [Flu]Vaccination in the United States – 2010-2018 data – ARCHIVE
- “CDC estimates that influenza vaccination during the 2014-2015 influenza season prevented 1.4 million illnesses, 700,000 medical visits, 39,000 hospitalizations and 3,700 deaths associated with influenza”
November 22, 2019 – CDC: How CDC Estimates the Burden of Seasonal Influenza in the U.S. – ARCHIVE, 2018 page – ARCHIVE, CDC influenza-associated deaths data 2010-2019- ARCHIVE
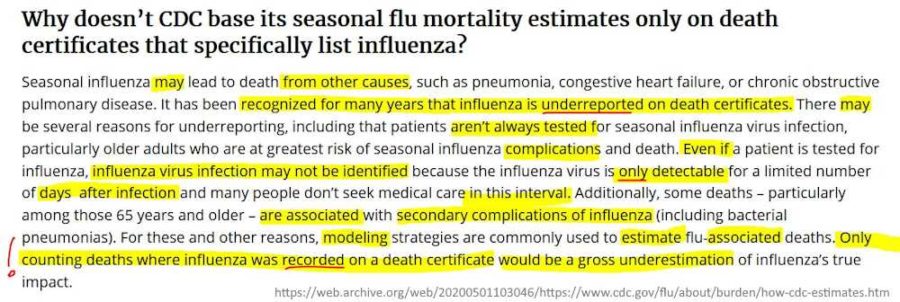
- Why doesn’t CDC base its seasonal flu mortality estimates only on death certificates that specifically list influenza? [Answer – because the number’s wouldn’t be scary enough]
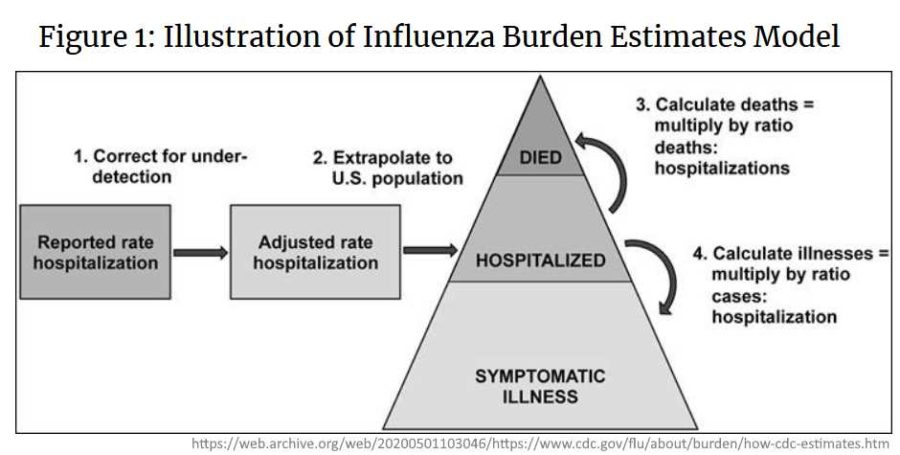
- “CDC uses a mathematical model to estimate the numbers of influenza illnesses, medical visits, hospitalizations, and deaths in the United States, as well as, the impact of influenza vaccination on these numbers.” They call it influenza-associated deaths
- “Seasonal influenza may lead to death from other causes, such as pneumonia, congestive heart failure, or chronic obstructive pulmonary disease. It has been recognized for many years that influenza is underreported on death certificates.” [Seems this dates back to 1918 pandemic! see below]
- “Even if a patient is tested for influenza, influenza virus infection may not be identified because the influenza virus is only detectable for a limited number of days after infection and many people don’t seek medical care in this interval.” [But we’ll call their case of death influenza anyway to help bolster the numbers!]
November 15, 2019 – CNN: Flu is getting an early start in the US this season – READ, CREDIT
- The US Centers for Disease Control and Prevention told doctors on a conference call this week that the United States is seeing more flu than is typical for this time of year.
- “Influenza is off to an early start,” said Dr. William Schaffner, an infectious disease expert at Vanderbilt University who was on the CDC call, which included members of the Influenza Hospitalization Surveillance Network [FluSurv-NET], a group of hospitals that help the CDC assess the severity of the flu season.”
- “Looking at the United States as a whole, CDC data shows more flu activity from September 29 to November 9 [2019] than in the same time period for six other flu seasons that CDC used as a comparison. Only one season in the comparison had more activity at this time of year: the unusually severe 2009 pandemic flu season that broke records.” [see 2010 below]
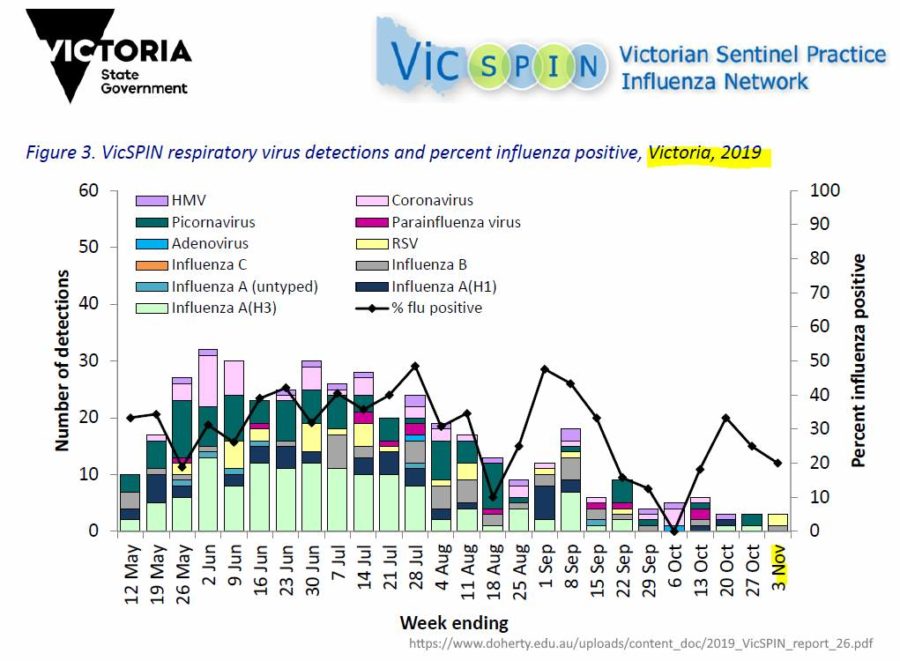
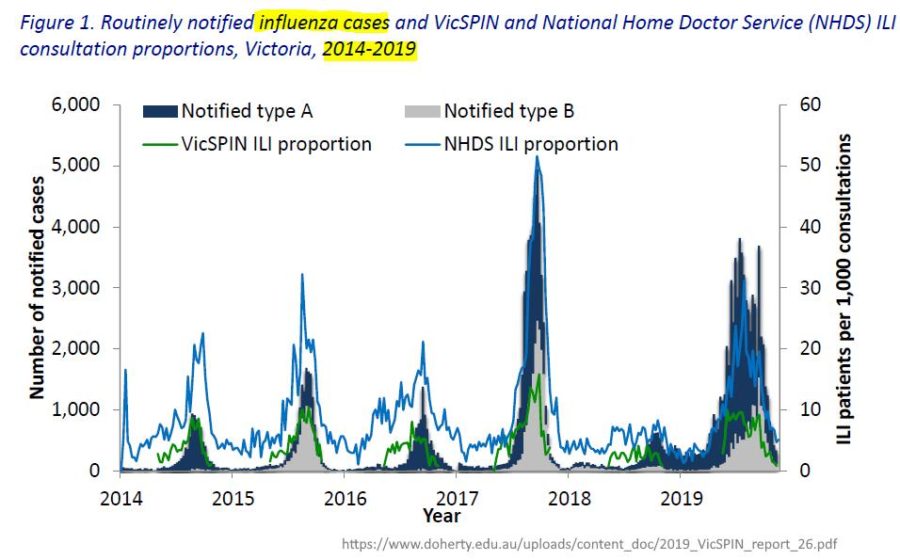
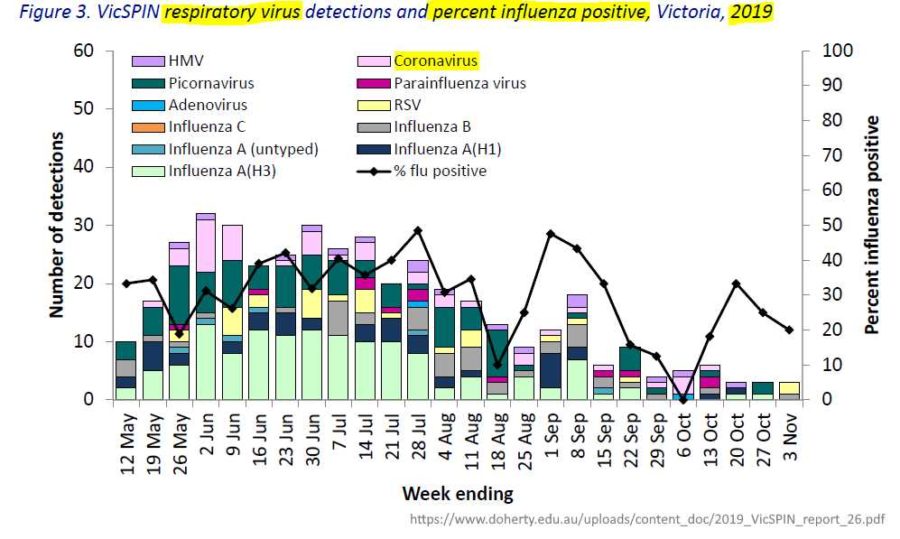
November 3, 2019 – AUSTRALIA – Victorian Sentinel Practice Influenza Network (VicSPIN) Report No. 26 – to get a baseline perspective – PDF, ARCHIVE
- On this report they state that “co-infections” occur. Did they stop testing for influenza as it likely would have shown up with SARS-CoV-2 as a co-infection?
October 15, 2019 (last updated) – CDC: U.S. Influenza Surveillance System: Purpose and Methods (links to flu surveillance sites and information) – ARCHIVE
September 26, 2019 – CDC: National Press Conference Kicks Off 2019-2020 Flu Vaccination Campaign, CDC and the National Foundation for Infectious Diseases (NFID) – READ
- “CDC’s recommendation for everyone age six months and older to get an annual flu vaccine.”
- Alex Azar “Flu vaccination can keep you from getting sick, it can keep you out of the hospital, and it can even save your life.” [so not stop infection, not stop spread!]
- National Foundation for Infectious Diseases (NFID) newsroom – READ
2010
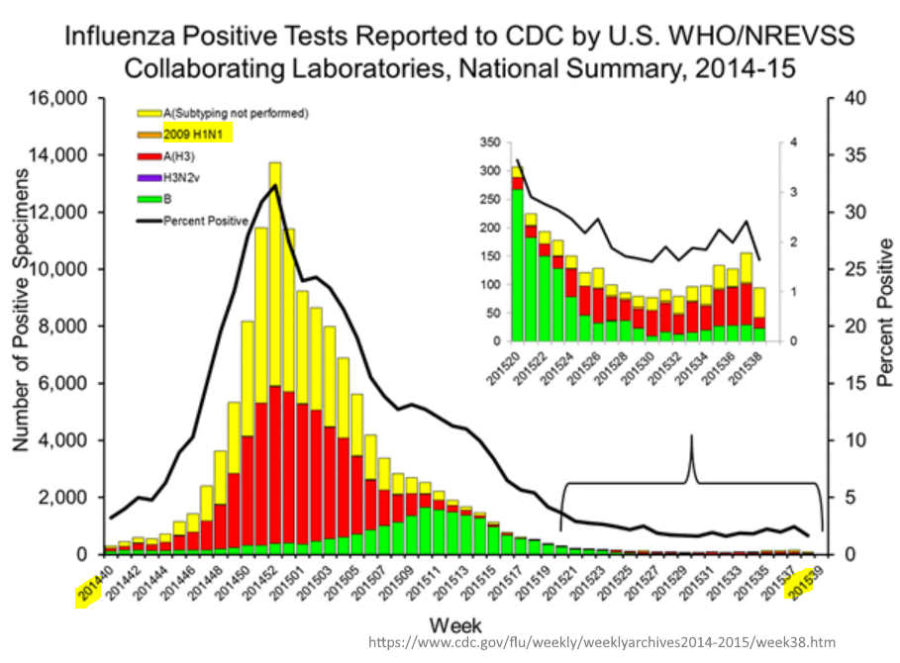
May 15, 2010 – CDC FluView: 2009-2010 Influenza Season Week 19 ending May 15, 2010 – READ, SOURCE
- Influenza Positive Tests Reported to CDC by U.S. WHO/NREVSS Collaborating Laboratories, National Summary.
CDC provides only up to Week 16 2010, then makes separate graph with all Pandemic 2009-2010 influenza.
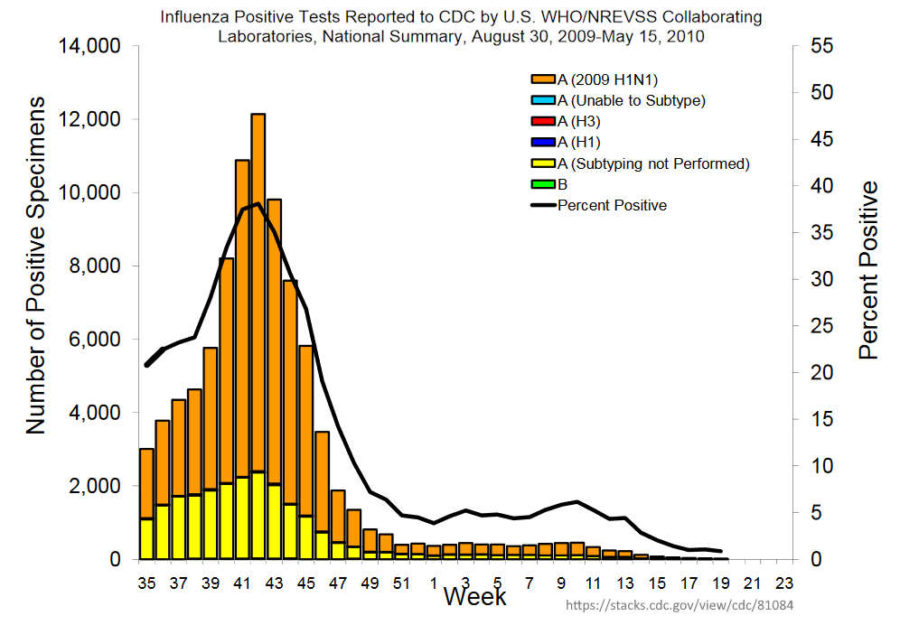
August 30, 2009 (week 35) to May 15, 2010 (week 19) –source
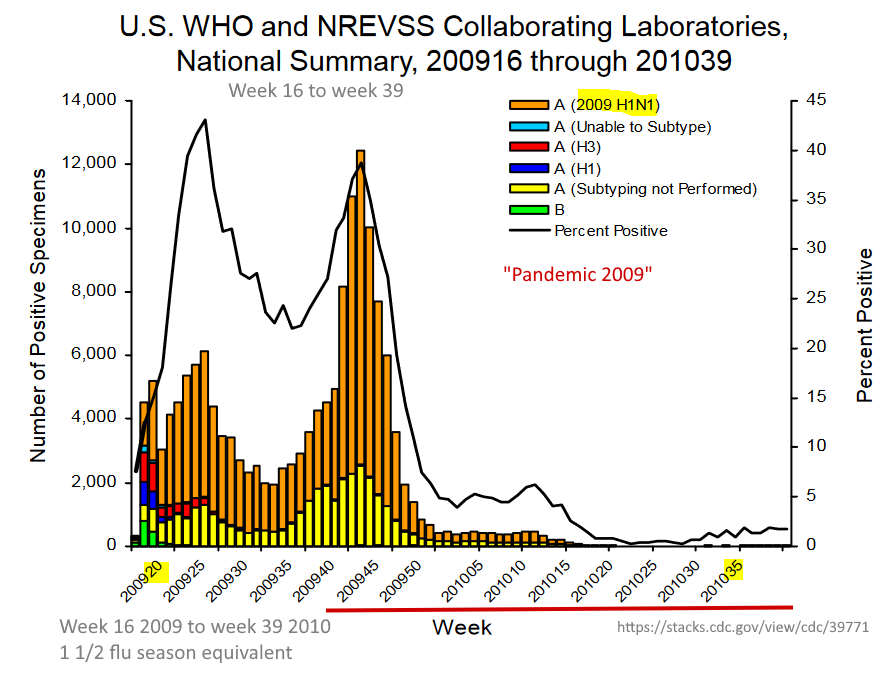
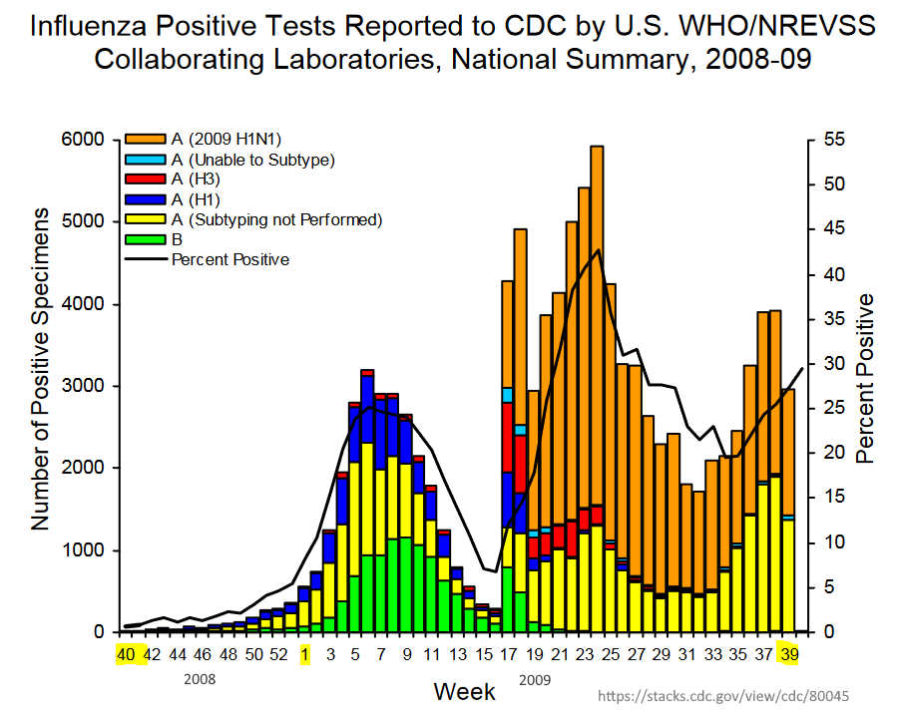
2008 (week 40) to 2009 (week 39)
the start of H1N1 influenza “2009 pandemic”
N1H1 disappeared without a vaccine!
2009
September 4, 2009 – Estimating Deaths from Seasonal Influenza in the United States – ARCHIVE
- CDC estimated that about 36,000 people died of seasonal flu-RELATED causes each year, on average, during the 1990s in the United States according to 2003 JAMA study (1990-1999 respiratory seasons including RSV) –
- [2003 study estimate 36,000 associated deaths, 2009 est. 25,470 which CDC call “similar” – papers are below each by Thompson et al]
January 2009 – Journal of Influenza and Other Respiratory Viruses: Estimates of US influenza-associated deaths made using four different methods – William W. Thompson (CDC) et al – READ, ARCHIVE, SOURCE
- From the 1976/1977 through the 2002/2003 seasons there were an estimated average of 25,470 influenza-associated respiratory and circulatory deaths.
2003
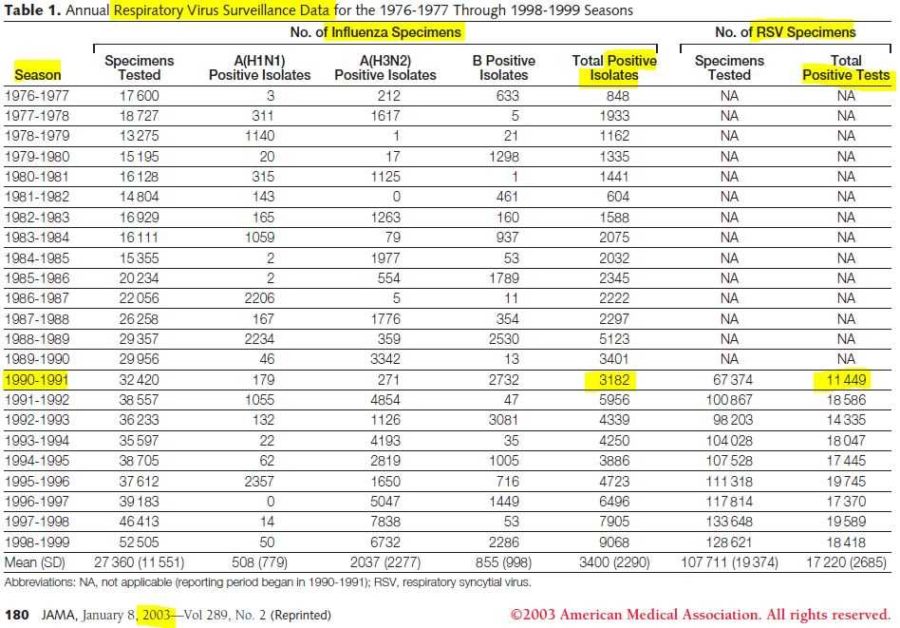
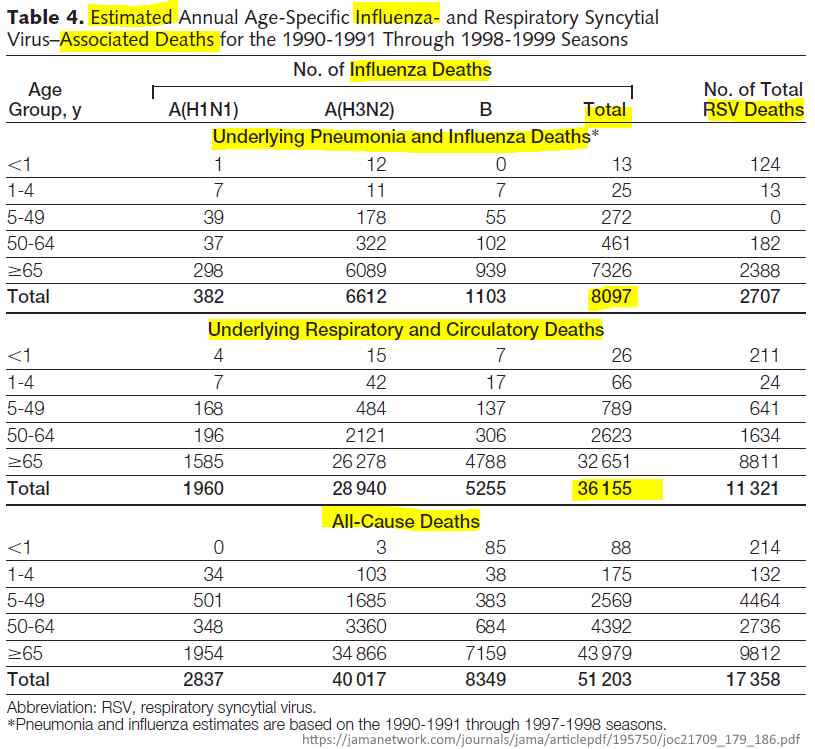
January 8, 2003 – JAMA: Mortality Associated With Influenza and Respiratory Syncytial Virus in the United States – William W. Thompson – ARCHIVE, PDF
- Assessing deaths attributed to 3 categories: underlying pneumonia and influenza, underlying respiratory and circulatory, and all causes.
- Pneumonia and influenza estimates are based on the 1990-1991 through 1997-1998 seasons
- Conclusion: “Influenza [RELATED] deaths have increased substantially in the last 2 decades, in part because of ageing of the population, underscoring the need for better prevention measures, including more effective vaccines and vaccination programs for elderly persons” And the predominance of Influenza A (H3N1), the most “virulent” of the viruses.
- [And there you have it, justification for flu vaccines for the elderly, and for all healthcare workers who tend to their needs!]
- CDC quotes this paper as estimating “seasonal flu-related” deaths each year at 36,000!
1997
1997 – Is when the CDC began “current reporting” of influenza records – REF By “current” I believe they mean using computer modelling to estimate the disease ‘burden’.
1918-1919
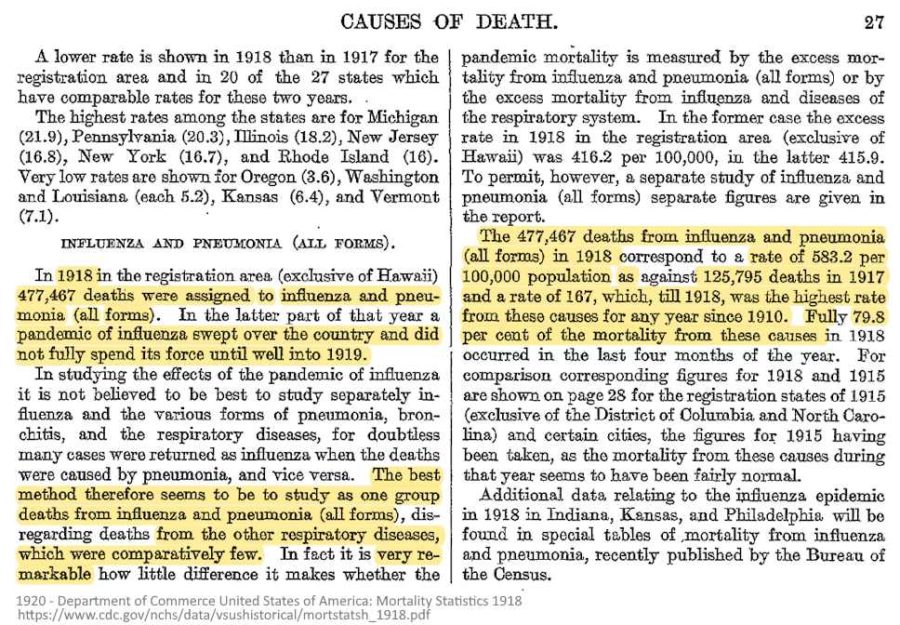
As reported by the CDC’s own mortality statistics, all other respiratory viruses effectively disappeared during the 1918-19 pandemic. Everything was categorised as either influenza or pneumonia.
In studying the effects of the pandemic of influenza is is not believed to be best to study separately influenza and the various forms of pneumonia, bronchitis, and the respiratory diseases, for doubtless many cases were returned as influenza when the deaths were caused by pneumonia, and vice versa.
The best method therefore seems to be to study as one group deaths from influenza and pneumonia (all forms), disregarding deaths from the other respiratory diseases, which were comparatively few. In fact it is very remarkable how little difference it makes whether the pandemic mortality is measured by the excess mortality from influenza and pneumonia (all forms) or by the excess mortality from influenza and diseases of the respiratory system.
As stated in CDC mortality statistics report 1918 & 1919